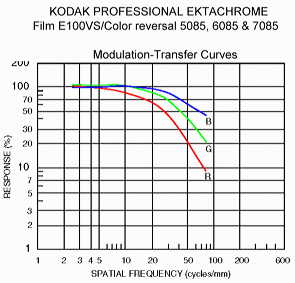
This is a typical MTF curve. In this case, it's for a particular film stock. Now many people, including those who should know better, will look at this curve and assume the end of the curve gives us the limits of this particular film's resolving power. So in this case they will see the curves terminate at 75 cycles/mm and conclude from such that the "resolution" of this film would be 75 cycles/mm, or in pixel terms, assuming Super8 film:
422 pixels per Super8 width (75 x 5.63 mm)
Or using Nyquist logic:
844 pixels per Super8 width ( 2 x 7 x 5.63 mm)
However, where the curve terminates is completely insignificant. It only represents where the measurements have stopped being made - not where the response of the film suddenly comes to a stop. An MTF graph represents the measured relationship between a pre-defined sinusoidal signal (of varying frequency) to which the film is exposed, and the response of the film (understood in terms of contrast) in relation to that signal. The result provides us with a way of comparing films stocks in terms of resolution. It doesn't provide us with a way of determining any pixel version of such.
Measurements are typically stopped once the response reaches a certain level, eg. at the 10% mark. In the case of this graph we see the red curve terminates around the 10% mark. But as mentioned this is purely arbitrary. The other curves are plotted up to the frequency at which the red is otherwise terminated (at the 10% response mark). But in terms of response they are terminated earlier than the red mark (at 20% for green and about 48% for blue). One can terminate the graph anywhere, for there's no significance in such. For what is important is not where it ends but what is being plotted, which is the measured relationship between frequency and response over an arbitrary range.
So why don't they just continue the measurements until a zero response is reached?
Well for one thing the resulting chart would be infinitely tall and infinitely wide. For at zero response, the lines/mm would be at infinity/mm, regardless of film stock. So it's obviously not necessary to include that information. One can just assume that. And if you look at the chart you'll see there is no zero line. This is because the chart uses a log scale. If you extend the chart down further you'll never get to include a zero line. You'll just get increasingly larger spaces in which to accommodate fractions closer and closer to zero. So you never reach a point where you can write down a zero response. And to the right you'll never get to infinity no matter how small you make the gaps between the values there.
But from the chart we can get an idea of the rate at which the frequency/response curve approaches an infinite frequency/zero response limit. And we can compare that to other curves for other film stocks. The more familiar we become with particular film stocks in terms of how they look with respect to their charts, the more easily we can read such charts, and to get a mental picture of a film stock we haven't previously seen. It's the curve that matters, not where it ends.
But apart from comparing filmstocks, there is also in this, the basis for what might be meant by the idea of film having "infinite resolving power". On a theoretical level it has this, but at that power it would also have a zero response, ie. you wouldn't be able see what it looks like! So it's purely theoretical. But we can come back in from this theoretical limit, back into the world of that which is visible (measureable), or potentially so, and the question we might ask ourselves is not where the measurements stop (or where to stop measurements) when drawing up such a graph (for that is arbitrary), but at what response level might our eyes accord, or some machine version of such?
However the answer to that is that there is no answer.
Selecting an arbitrary level like 10%, is a way of side-stepping the assumptions in such a question. It's as good a figure as any at which to stop when making measurements and plotting the resulting curve. Indeed once you have a certain amount of the curve you can just mentally extend it into the sub 10% domain. But if you're looking for where to terminate the line, there isn't any. The lines/mm increases indefinitely, and the response decreases indefinitely.
There is a kind of no-mans land into which the film descends, as much as our eyes/brain might equally descend. There's no way of translating this into pixel versions of the same, except arbitrarily (or pragmatically).
C